
Scorecard Features & Benefits
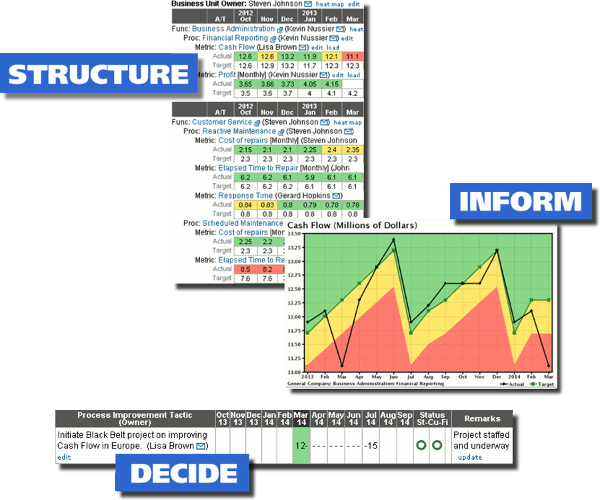
Your Structure, Your Information, Informed Decisions
PlanBase can be easily configured to reflect your organizations structure, entities, functions, processes, value streams etc. The cascading layers of scorecards ensure that your strategic and operational goals are visibly aligned across and down your organization. Then you can turn the data into information with just a few clicks on your PC, laptop, tablet or smartphone. You can see on-line, real-time updated metrics, corrective actions, line graphs and Pareto charts in a concise and consistent format. You can view at the highest levels of the organization or drill down through the connected layers to understand how the organization is achieving its goals.
Contact us to schedule a live demo. You can also view the Scorecard Video Demonstration.
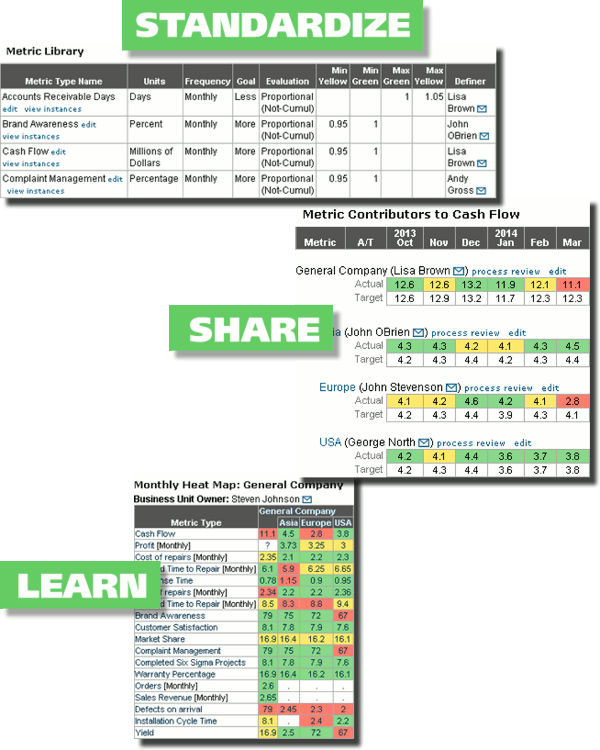
Establish a Basis for Organizational Learning
Contact us to schedule a live demo. You can also view the Scorecard Video Demonstration.
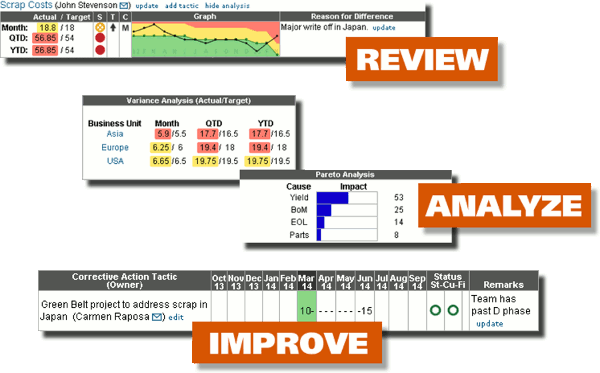
Achieve Visible Improvement and Eliminate Duplicate Reporting
Contact us to schedule a live demo. You can also view the Scorecard Video Demonstration.
Additional PlanBase Scorecard Features
- Customized Metric Views
- PlanBase Scorecard enables users to design their own dashboards with their personal KPI’s front and center. Focus on what matters to your role by highlighting the metrics you own and can influence performance.
- Connect Scorecards to Strategic Plans
- PlanBase Scorecard, integrated seamlessly with PlanBase Hoshin, brings together operational metric management with strategic initiatives. Connecting corrective actions with the larger breakthrough goals helps to align the organization around a common objective.
- Dynamic A3 Charts
- PlanBase enables the creation of dynamic A3 charts that bring together all relevant information in the same place to stay informed on the improvement initiative. Metric performance, including history, across all levels of the organization paired with analysis tools and corrective action tracking neatly close the process improvement loop.
- Load Metrics Data Automatically
- Once you have all of your organization’s KPI’s in PlanBase Scorecard there is going to be a lot of data at your fingertips. PlanBase makes it easy to load data on a monthly cadence with Batch Data Loads, allowing you to focus on turning those red metrics green.
- Sensitive Metrics Get Special Treatment
- All organizations have those metrics that are sensitive in nature and shouldn’t have public future targets. PlanBase supports this need through our “financial” metrics which have their own area and analysis tools such as AOP, ROFO, and Latest View.
Contact us today to check out even more features.